TradingView PANEL Indicator

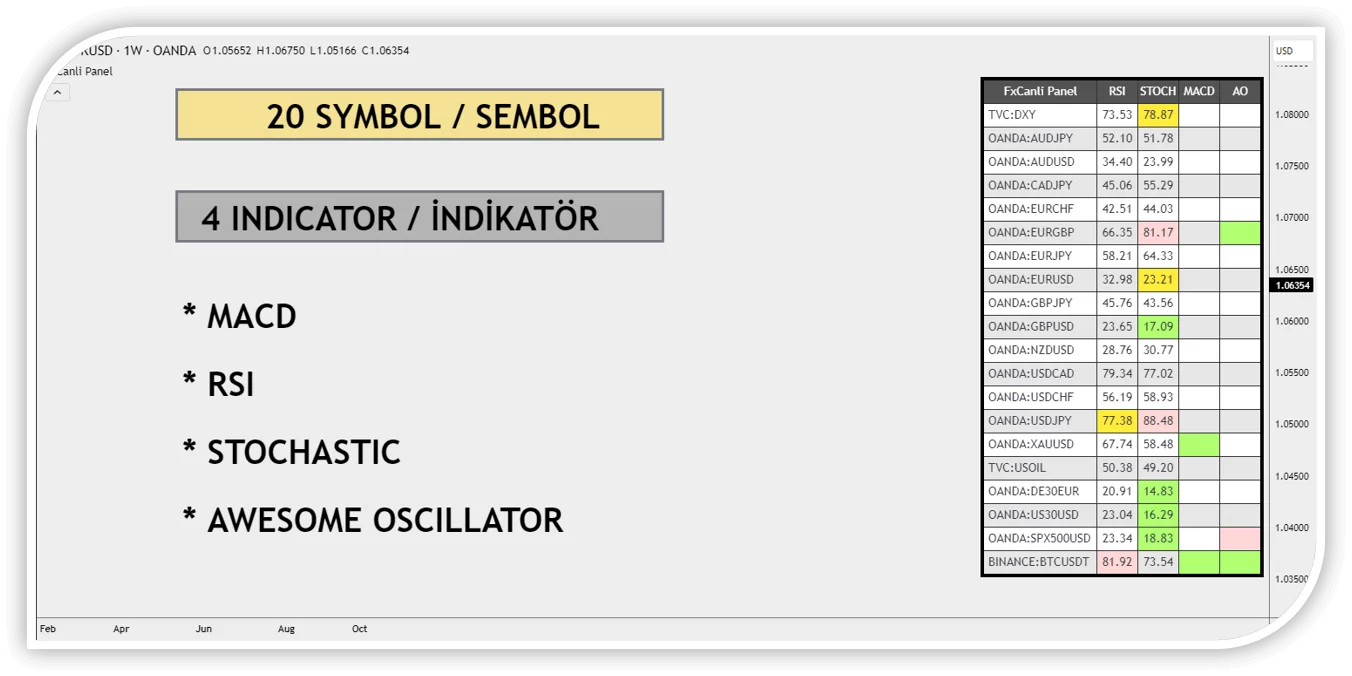
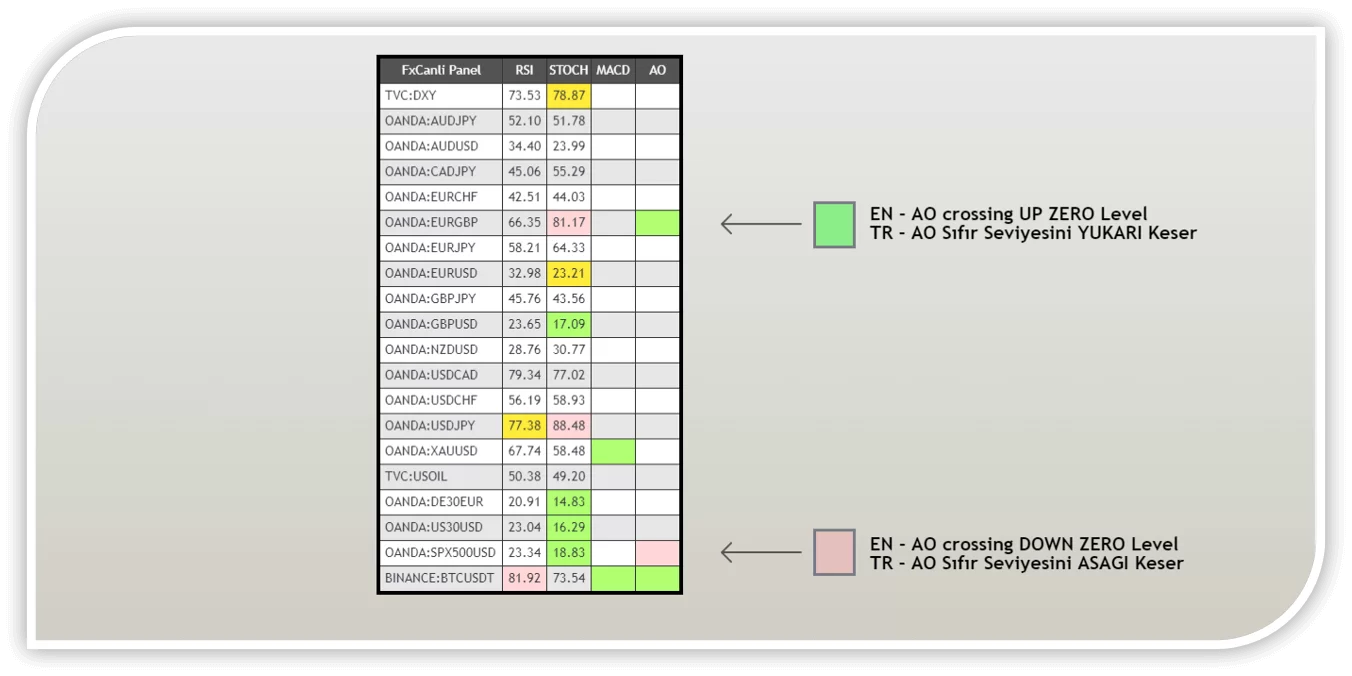
Panel Indicator allows you to track RSI, Stochastic, MACD, Awesome Oscillator values of 20 different pairs on a single chart at the same time on a single panel,

It is a TradingView indicator that sends you instant notifications when pairs are in or out of overbought/oversold zones with its alarm feature.

forex trading course

SOFTWARE INFORMATION

free forex signals gif

TRADINGVIEW PANEL INDICATOR features

Price Action indicator

Wherever you are, the Panel Indicator is there

ALERTS AND NOTIFICATIONS

The most popular feature of the TradingView Panel indicator is the alarm feature, which is sent as a pop-up on your computer screen, as a notification on your phone and tablet with TradingView installed, and as a notification on your Smartwatch.

Incoming alarms and notifications;

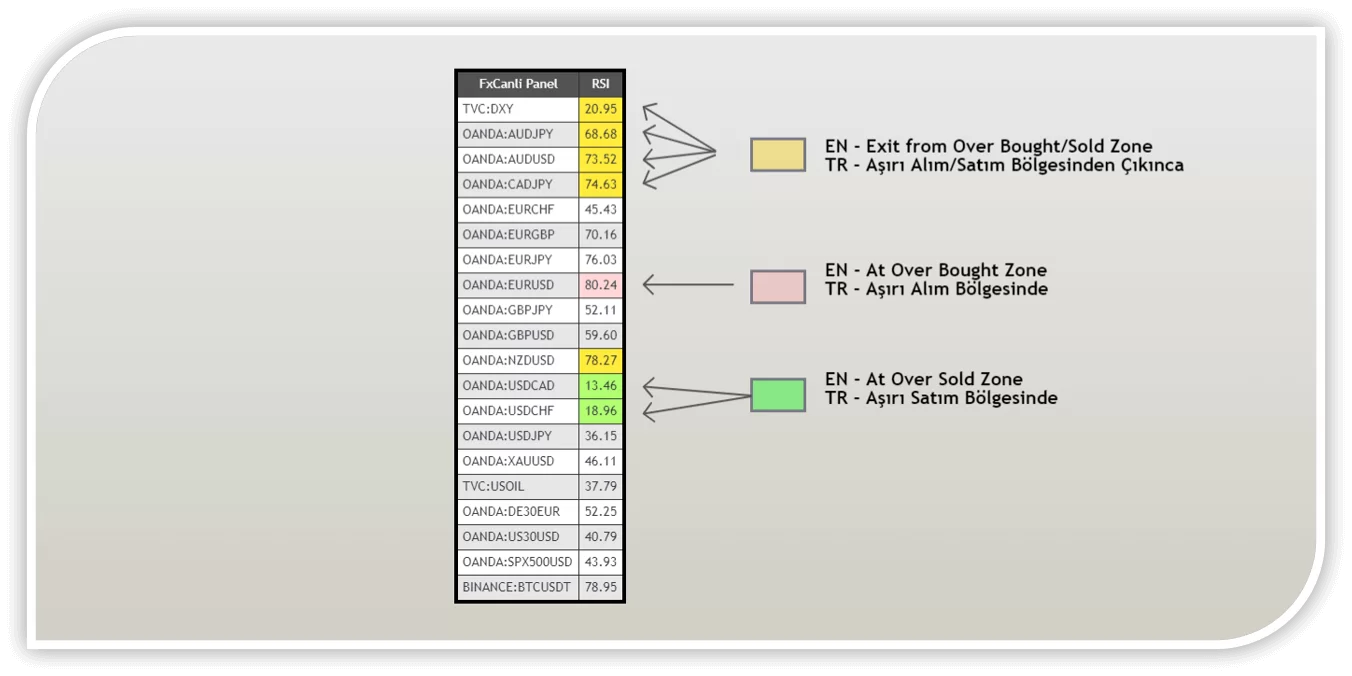
  • When the RSI reaches the overbought/sold zone,
  • RSI Exiting the overbought/sold zone,
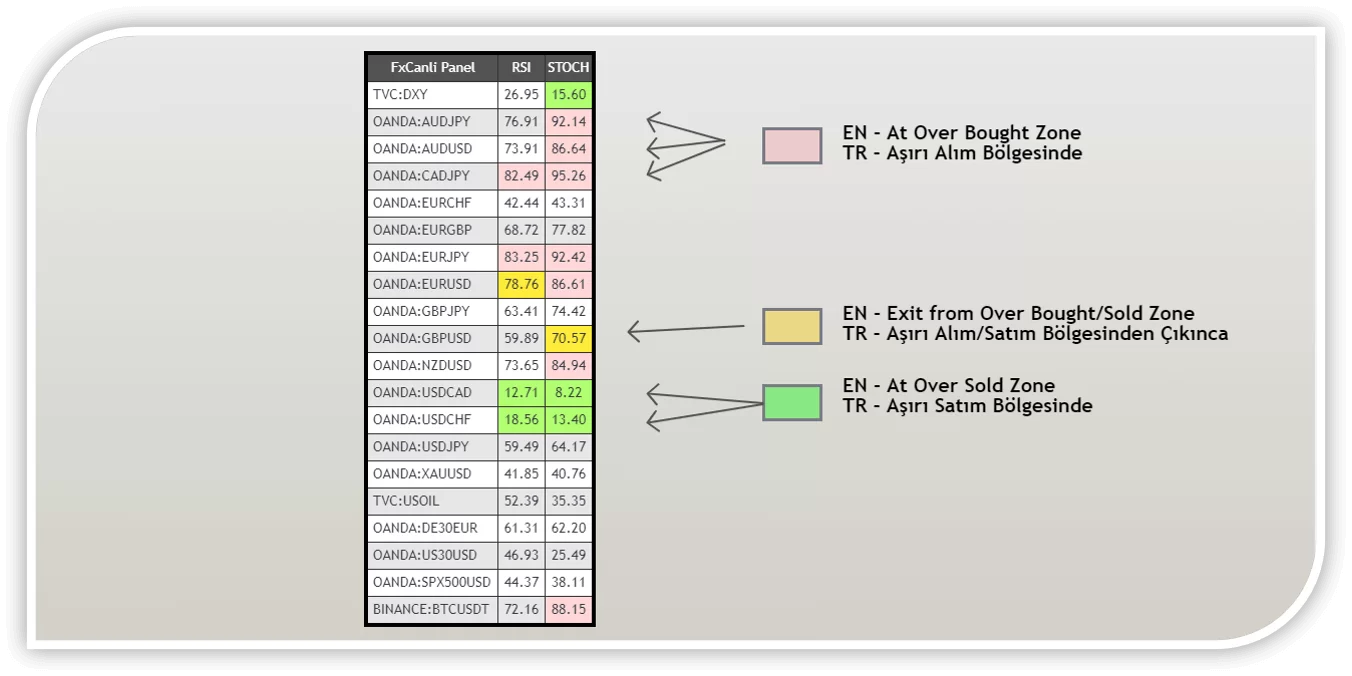
  • Stochastic When it reaches the overbought/sold zone,
  • Stochastic When exiting the overbought/sold zone,
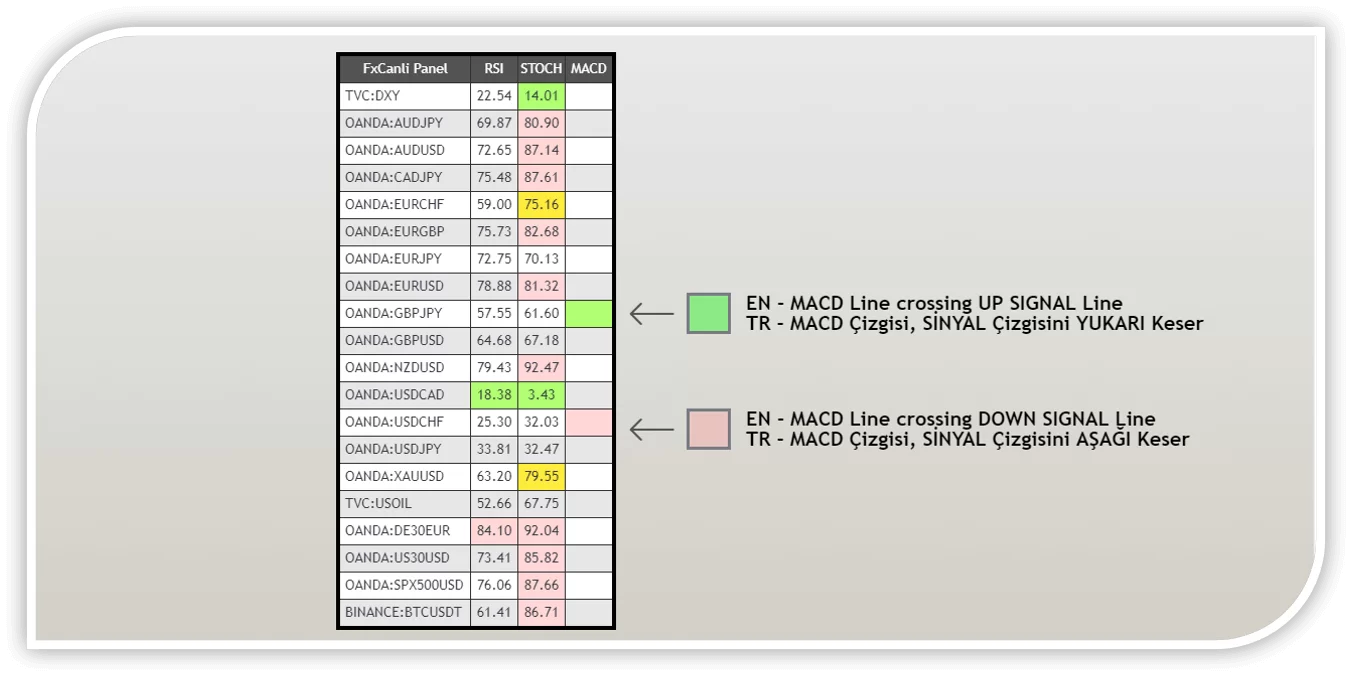
  • MACD When MACD moves into the overbought/sold zone,
  • MACD Exiting the overbought/sold zone,
  • Awesome Oscillator As the uptrend begins
  • Awesome Oscillator will notify you when the downtrend starts.

RSI

The Relative Strength Index (RSI) is used to assess whether an asset is overbought or oversold.

The RSI produces a value between 0 and 100 by analyzing the asset’s gains and losses over a given time period. Typically, RSI values above 70 can indicate overbought, while values below 30 can indicate oversold. These states provide traders with information about the current state of the asset.

Stochastic

Stochastic works by evaluating the closing prices of the asset in a given time frame.

The Stochastic indicator produces a value between 0 and 100. Usually, values above 80 may indicate overbought, while values below 20 may indicate oversold. It helps traders make decisions by providing information about the asset’s strength and momentum.

MACD

Positive values of MACD (Moving Average Convergence Divergence) usually indicate a bullish (buy) trend, meaning that the asset is in an uptrend. Negative MACD values, on the other hand, indicate a bearish (sell) trend, meaning that asset prices are in a downtrend.

Awesome Oscillator

The Awesome Oscillator measures the difference between the price’s short-term momentum and long-term momentum.

If the Awesome Oscillator is positive, it usually indicates buying pressure and signals bullish momentum. If it is negative, it indicates that there is selling pressure and signals bearish momentum.

PLANS AND PRICING

Free Trial

With Symbols

NZD and DOGE

FREE for Lifetime
  • All Features in Full License
  • Forex, Crypto, Stock Exchange, Commodities, Futures
  • Mobile, Tablet, Desktop, Laptop
  • Alert and Notifications

Panel Indicator

$19/ Monthly

$79/ Annual

$249 / Lifetime
  • Forex, Crypto, Stock Exchange, Commodities, Futures
  • Mobile, Tablet, Desktop, Laptop
  • Alerts And Notifications
  • Free Updates

TradingView FULL Package

$49/ Monthly

$499/ Annual

$1499 / Lifetime

FREE TRIAL

4 steps to FREE Try TradingView Indicators

TradingView Destek Direnc Gif

HARMONIC SNIPER

Indicator

HARMONIC SNIPER

TradingView Indicator

Learn More
TradingView Destek Direnc Gif

PRICE ACTION

Indicator

PRICE ACTION

TradingView Indicator

LEARN MORE
TradingView Destek Direnc Gif

SUPPORT & RESISTANCE

Indicator

SUPPORT & RESISTANCE

TradingView Indicator

LEARN MORE
TradingView Destek Direnc Gif

TREND

Indicator

TREND

TradingView Indicator

LEARN MORE
TradingView Destek Direnc Gif

PRZ

Indicator

PRZ

TradingView Indicator

LEARN MORE
TradingView Destek Direnc Gif

ZIGZAG

Indicator

ZIGZAG

TradingView Indicator

LEARN MORE

FREQUENTLY ASKED QUESTIONS

SUBSCRIPTION

    ALWAYS FIRST!

    Sign up for new projects and offers.

    (We'll not spam and you can unsubscribe whenever you want.)

      FX Canlı
      Signup for FREE MetaTrader 4 Indicators & Scripts & Combos
      MetaTrader 4
      INDICATORS & SCRIPTS & COMBOS
      FREE TRIAL