SUBSCRIPTION
- Be aware of new projects!
- Join free webinars!
- Try new indicators first!
- Take advantage of all discounts!

The TradingView Price Reversel Zone (PRZ) indicator is the TradingView indicator that shows you possible reversal zones on your charts.
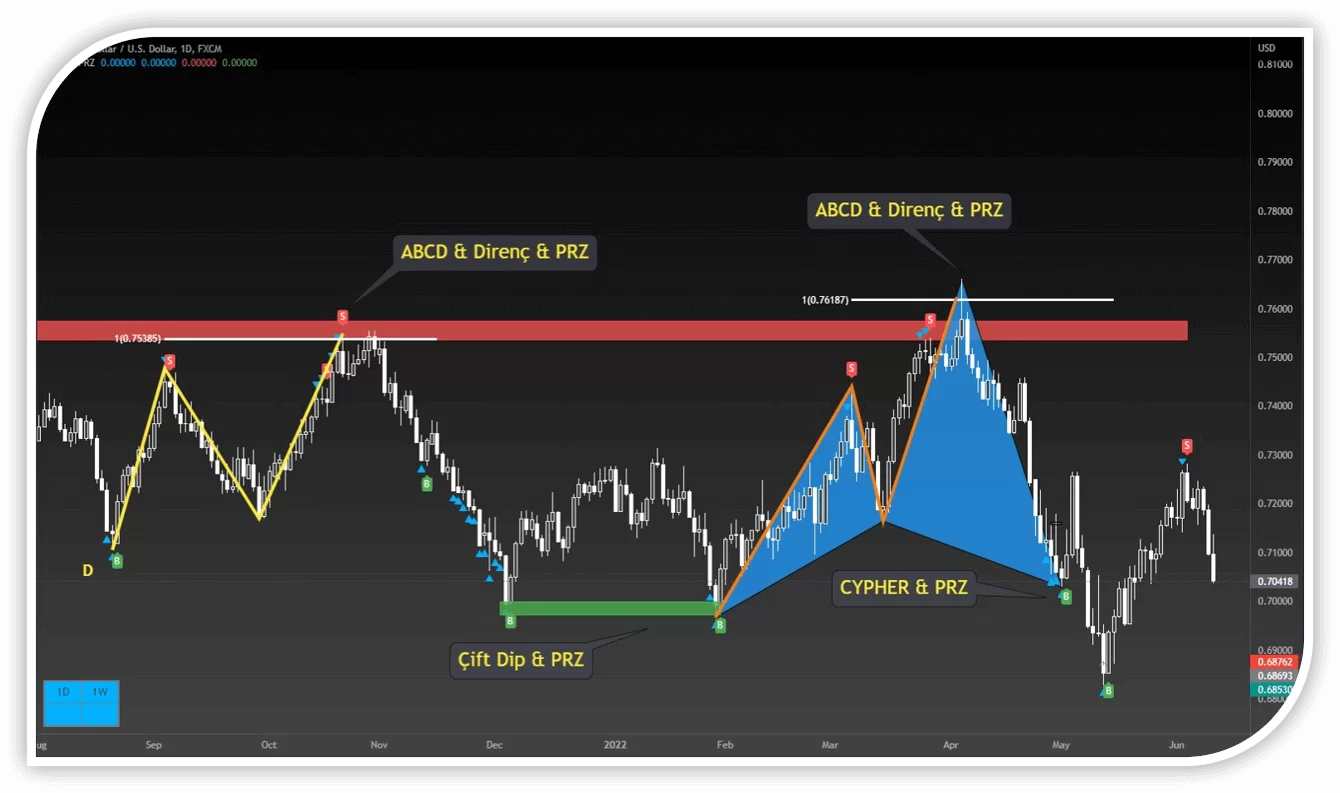
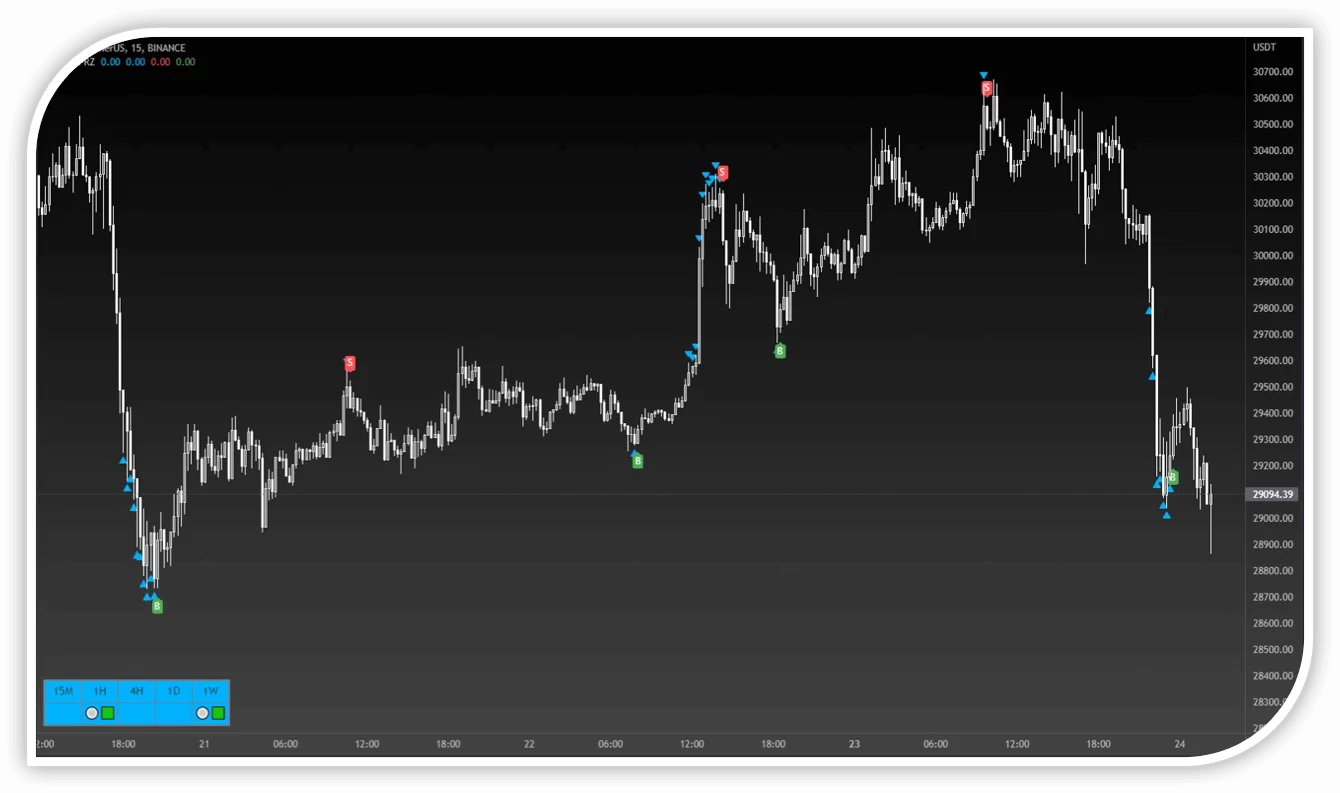
The TradingView Trend indicator shows the PRZ (Potential Reversal Zone) zones, i.e. the possible reversal zones, with blue triangles. After the blue triangle is lit, the triangle can continue to burn in the ongoing movement. In such cases, it is necessary to wait for the candle close where the triangle does not burn.
The most popular feature of the TradingView PRZ indicator by users is; is an alarm feature that is sent as a pop-up on your computer screen, as a notification on your phone and tablet with TradingView installed, and as a notification on your Smart watch.
Incoming alarms and notifications;
TradingView PRZ gives Buy – Sell signals with the tags (B)uy, (S)ell.
By combining these signals with the strategies shown below, you can increase your success rate in your trades.
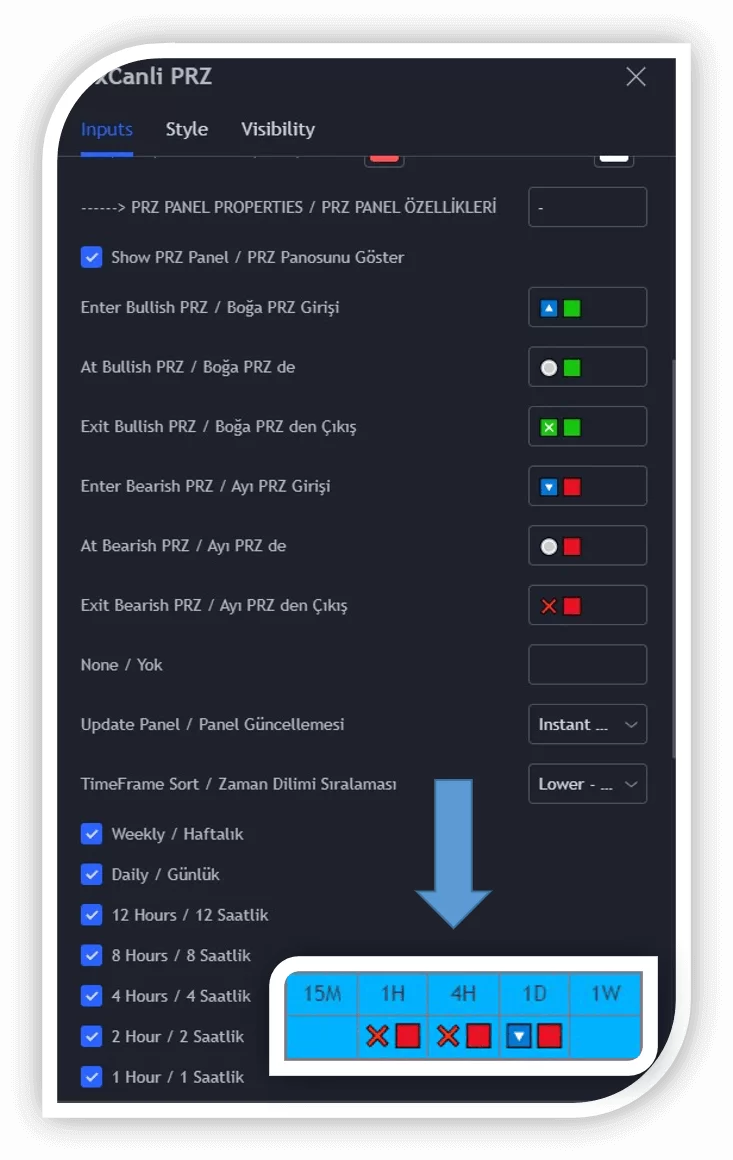
Thanks to the PRZ Panel feature, it allows you to see PRZ signals in all time zones at the same time over a single time zone. This feature;
If the TradingView PRZ indicator signals where support channels break and turn into resistance, the success rate of the strategy increases.
If the TradingView PRZ indicator signals where resistance channels are broken and turned into support, the success rate of the strategy increases.
In AB=CD patterns, which are also frequently used in Elliott drawings, if the price is at AB=CD level and the TradingView PRZ indicator gives a signal, you will not believe the success results of the trades.
In 2618 strategies, you can achieve more successful results by having the Tradingview PRZ Indicator give an entry-level signal to trading.
On Libra patterns, if the TradingView PRZ Indicator gives a PRZ signal with a “Blue Triangle” at the libra point, it will support the trend reversal in your analysis.
If the PRZ indicator in the Double Bottom/Top zone starts giving PRZ signals with the sign “Blue Triangle”, this indicates that this trend is nearly reversed.
If the PRZ indicator in the Triple Bottom/Top zone starts giving PRZ signals with the sign “Blue Triangle”, this indicates that this trend is nearly reversed.
In the Gartley pattern, which is one of the most used Harmonic patterns in the financial markets, if the TradingView Trend Indicator gives a “PRZ” signal with the “Blue Triangle” at the level where the pattern is triggered, the success rate of the pattern will increase.
In the Bat pattern, which is one of the most used Harmonic patterns in the financial markets, if the TradingView Trend Indicator gives a “PRZ” signal with the “Blue Triangle” at the level where the pattern is triggered, the success rate of the pattern will increase.
In the Cypher pattern, which is one of the most used Harmonic patterns in the financial markets, if the TradingView Trend Indicator gives a “PRZ” signal with the “Blue Triangle” at the level where the pattern is triggered, the success rate of the pattern will increase.
In the Butterfly pattern, which is one of the most used Harmonic patterns in the financial markets, if the TradingView Trend Indicator gives a “PRZ” signal with the “Blue Triangle” at the level where the pattern is triggered, the success rate of the pattern will increase.
In the Crab pattern, which is one of the most used Harmonic patterns in the financial markets, if the TradingView Trend Indicator gives a “PRZ” signal with the “Blue Triangle” at the level where the pattern is triggered, the success rate of the pattern will increase.
Indicator
Indicator
Indicator
Indicator
Indicator

Indicator